



An AI-powered index of U.S. deregulation and its macroeconomic effects
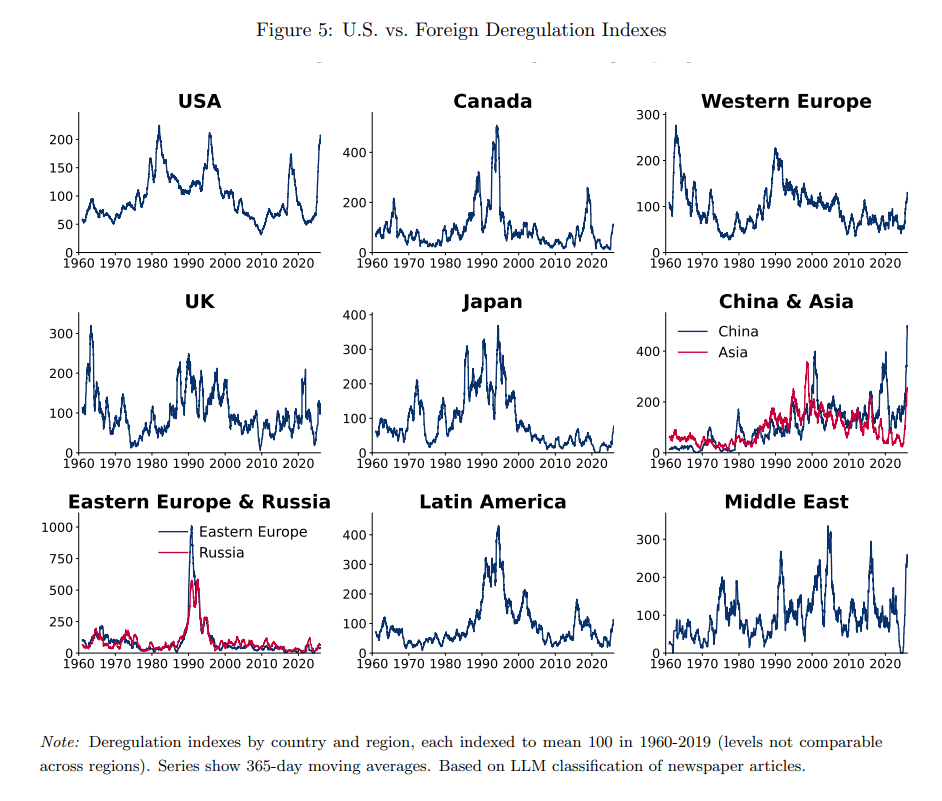
Danilo Cascaldi-Garcia and Matteo Iacoviello construct a news-based deregulation index for the United States spanning 1960–2025. The approach works in two stages:
- Article collection: They retrieve 611,000 articles from the New York Times, from 1960 to 2025, matching a Boolean query designed to capture regulation-related economic content.
- AI classification: Each article’s first 3,000 characters are evaluated by OpenAI’s GPT-4o-mini, which assigns a deregulation intensity score (0.0 to 1.0) based on whether the article discusses increased regulation or deregulation, the centrality of deregulatory content, and whether it covers advocacy, proposals, or enacted measures.
They further decompose the index by sector (finance, energy, telecom, transportation, etc.), by policy stage (proposed vs. enacted), by type of deregulation (price controls, entry barriers, product/service standards, etc.), and by geography. A parallel index constructed from Federal Register documents, from 1995 to 2025, validates the news-based measure, with the news index leading the Federal Register index by approximately one year, consistent with media coverage reflecting policy intentions before formal implementation.
For the empirical part of the paper, the authors use data such as utilization adjusted total factor productivity, real per capita GDP, real per capita investment, real per capita consumption, per capita hours worked, personal consumption expenditures (PCE) price index, the 1-year Treasury yield, real per capita government expenditure, the S&P 500 index, consumer confidence, the CBOE volatility index (VIX), real per capita corporate profits, and corporate profits tax rate.
Findings
- GDP and productivity: Positive deregulation shocks boost GDP and productivity, though productivity effects build gradually over multiple years.
- Investment: Investment responds more strongly than GDP, consistent with deregulation stimulating capital formation.
- Financial markets: Stock prices surge immediately following deregulation shocks, while the VIX declines, suggesting reduced economic uncertainty.
- Employment and prices: Employment expands; the price level declines slightly, indicating deregulation operates primarily through supply-side channels.
- Industry-level evidence: Using sectoral deregulation indexes matched to 49 Fama-French industry portfolios in panel local projections, deregulation shocks produce positive and statistically significant industry returns on impact.
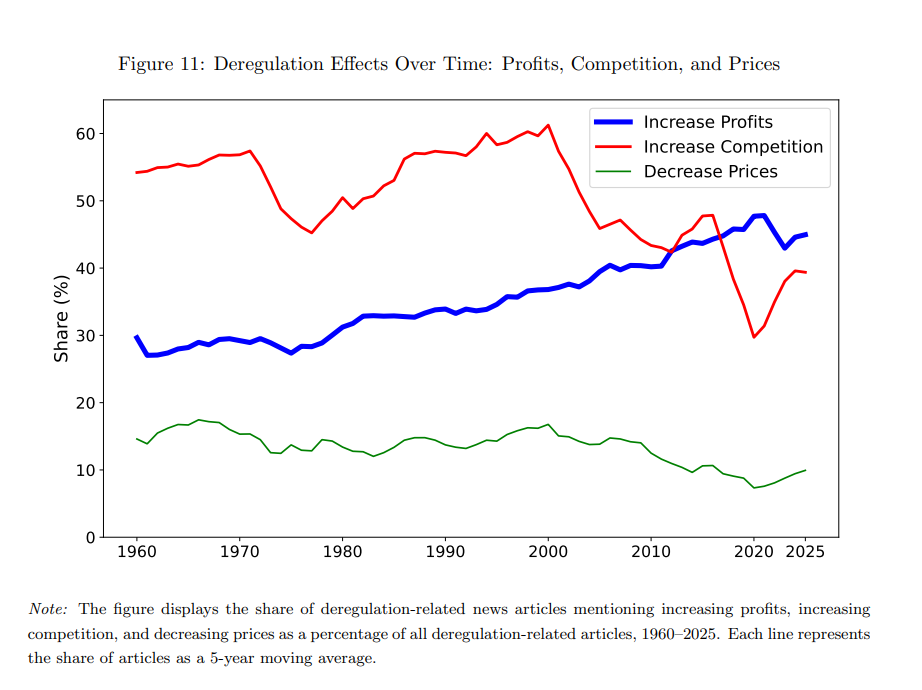
- Profits vs. competition: A notable finding is that deregulation appears to benefit incumbent profitability and operational efficiency more than competitive entry.
The paper’s major historical episodes include transportation and telecom liberalization (1970s–80s), financial deregulation (1980s–90s), and the sharp rise in deregulatory activity during the first and second Trump administrations.
Quantifying Deregulation and its Economic Effects: A Large Language Model Approach
Authors: Danilo Cascaldi-Garcia, Matteo Iacoviello
From: Federal Reserve Board
Regulation and productivity across OECD economies
This paper by Dan Andrews, Sébastien Turban, and Stefanos Tyros develops a task-based measure of regulatory compliance costs inspired by Trebbi, Zhang, and Simkovic (2023). The approach works in three steps:
- Task scoring: Using the O\NET database (for the U.S.) and the ISCO classification (for Europe and Australia), each occupation’s constituent tasks are scored as regulation-related based on keyword matching, manual checks, and word-embedding proximity to the term “regulation.”
- Occupation-level aggregation: Task-level scores are aggregated into an occupation-level “Regulation Intensity” score, weighted by the importance of each task within the occupation.
- State/country-level aggregation: Occupation scores are aggregated using employment and wage shares from BLS data (U.S.), EU Labour Force Surveys (Europe), and Australian Bureau of Statistics data to produce a Regulation Index — interpretable as the share of the wage bill (or employment) devoted to regulatory compliance.
The econometric analysis exploits variation across U.S. states and over time using two approaches: long-difference regressions (comparing 2012–2017 vs. 2018–2023 averages) and local projections to trace short-run dynamics.
Findings
- Compliance costs are material and rising. In the U.S., the wage share devoted to compliance tasks increased from 4.0% in 2012 to 4.2% in 2024 (equivalent to $521 billion or 1.8% of GDP). In Europe, an employment-based indicator rose from 3.7% to 3.9% over 2011–2023 — higher than the U.S. level, consistent with the Draghi Report’s assessment of heavier European regulatory burdens.
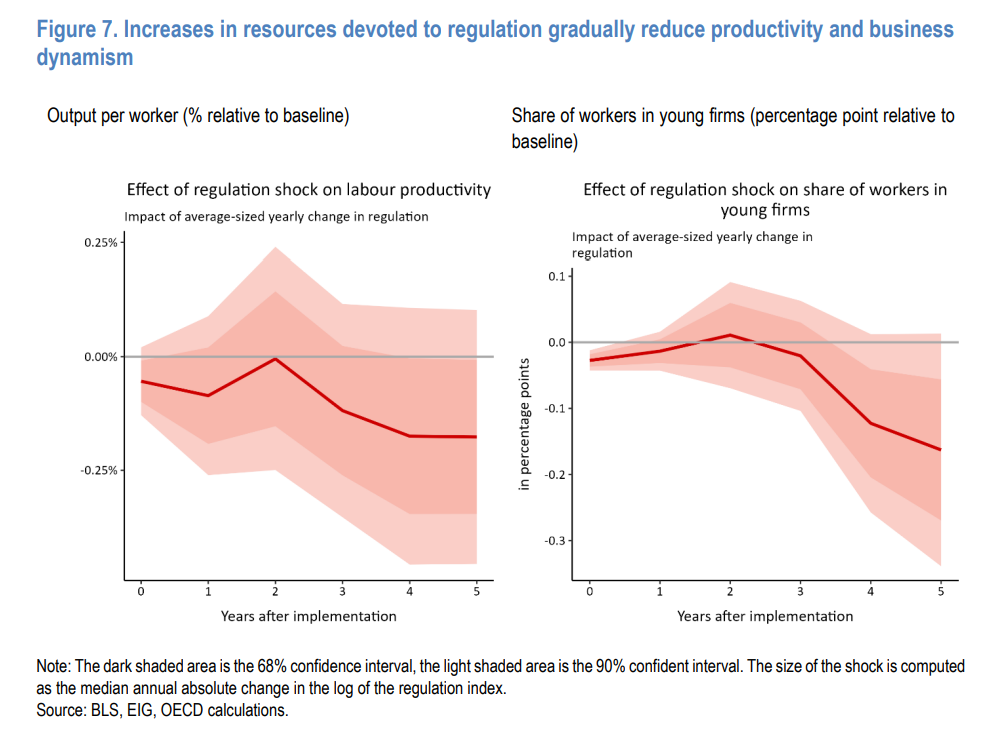
- Productivity drag. The 3% average increase in U.S. regulatory compliance costs over the past decade is associated with a 0.5% decline in labor productivity relative to a counterfactual of stable compliance costs.
- Business dynamism weakened. The same increase is associated with a 0.4 percentage point reduction in the employment share of young firms.
- Effects are gradual. Local projection estimates show that the impact on business dynamism takes about 3 years to become apparent, and a typical cut in regulatory costs could raise productivity by more than 0.2% after 5 years.
Regulatory compliance costs and productivity
Authors: Dan Andrews, Sébastien Turban, Stefanos Tyros
From: OECD
