• Twitter
  • Search
e-axes

360° Econ View

The issues, the debates, and the research

  • Home
  • Useful Data
  • About
  • Contact
  • Home
  • Useful Data
  • About
  • Contact

Macro

More on the Phillips curve

Posted by e-axes on May 10, 2023

Read Next →

Macro

AI Valuations, Capital Investment, and Growth

Macro

AI and the Natural Rate: Puzzle or Policy Challenge?

Macro

Transfers, Taxes, and the Ricardian Equivalence

An Inverted-L Phillips curve

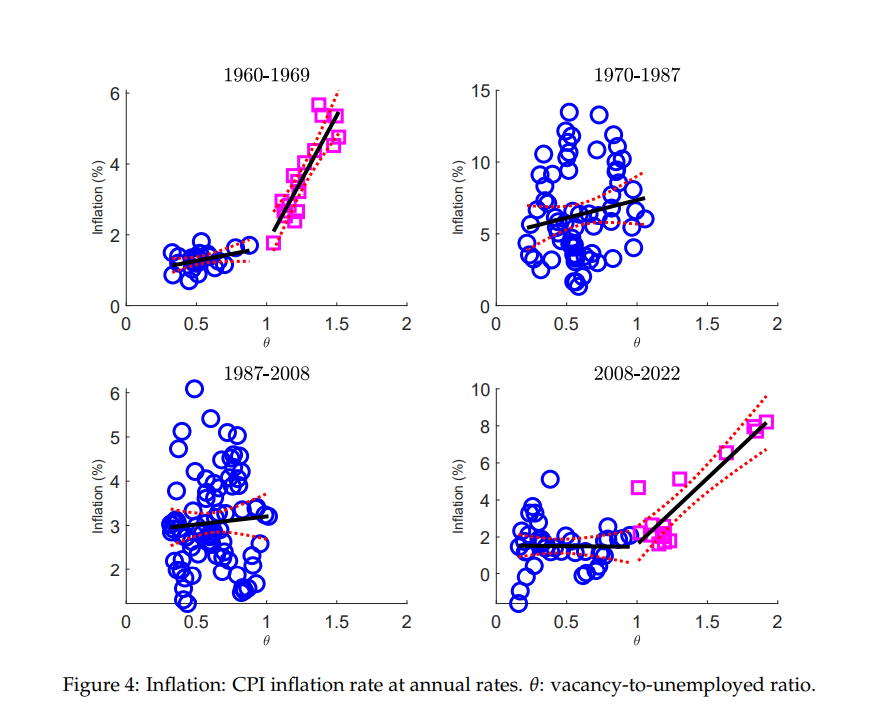
Why did policymakers assume that the 2020 surge in inflation was temporary? Because they assumed that the Phillips curve was flat, argue Benigno and Eggertsson. This was an erroneous assumption as policymakers failed to appreciate the impact of the unprecedented labor shortage caused by COVID-19, the type of shortage historically occurring only during wartime.
In this paper, Benigno and Eggertsson develop a New Keynesian model with search and matching frictions, complemented by a form of wage rigidity that generates strong nonlinearities. In this model, economic slack is measured as firms’ job vacancies over the number of unemployed workers. In the last 63 years, situations of labor shortage have emerged on two occasions: during the Vietnam War in the late 1960s a period also marked by a substantial demand stimulus, and the period around the COVID-19 epidemic (see figure below). They find that, labor shortages are associated with surges in inflation. As a result, the nonlinearities arise due to an imperfect labor market. The proposed New Keynesian Phillips curve is an Inverted L-curve that can explain the sharp, unexpected rise in inflation in the U.S. in the early 2020s following the COVID-19 pandemic. This new nonlinear Phillips curve implies:

  • Demand shocks played a greater role than supply shocks in explaining the surge.
  • Appropriate monetary policy can engineer a “soft landing” because inflation can be brought down quickly through a relatively small sacrifice in output.

It’s Baaack: The Surge in Inflation in the 2020s and the Return of the Non-Linear Phillips Curve
Authors: Pierpaolo Benigno, Gauti B. Eggertsson
From: University of Bern, Brown University

Breaks in the Phillips curve

In this paper, Smith et al. apply Bayesian panel methods with breakpoints to disaggregate data in order to study Phillips curve inflation dynamics. There are two reasons for which they look at disaggregate data, whether by industry, by region, or by country: a) there may be some cross-sectional heterogeneity which might shed light on the causes of changing Phillips curves; and b) since different regions and sectors experience different business cycles, there is extra information in disaggregate data that enables the identification of slope coefficients and regime changes more precisely than using aggregate data alone. The authors use U.S. industry data covering the sample 1959Q1-2022Q3.
For the U.S. they find a kink in the Phillips curve at a threshold of unemployment rates of 5 and 4.2 percent. Using these thresholds, they find that the Phillips curve is steeper in a tight labor market  and that “ignoring breaks has the effect of leading to underestimation of the additional steepness in tight labor markets in the most recent period.”
Breaks in the Phillips Curve: Evidence from Panel Data
Authors: Simon C. Smith, Allan Timmermann, Jonathan Wright
From: Federal Reserve Board

Print Friendly, PDF & Email

e-axes

Read Next →

Macro

AI Valuations, Capital Investment, and Growth

Macro

AI and the Natural Rate: Puzzle or Policy Challenge?

Macro

Transfers, Taxes, and the Ricardian Equivalence

Comments are Closed

Account

  • Login

Subscriptions

You are not logged in.
Login
Subscribe

Subscriptions

Subscribe

Most Read

  • Public Debt Maturity and Macroeconomic Policy Transmission
  • Bank Heterogeneity and the Transmission of Monetary Tightening
  • AI Valuations, Capital Investment, and Growth
  • New and Noteworthy Books in Economics (September)
  • AI and the Natural Rate: Puzzle or Policy Challenge?
  • Macroeconomic Risk: From Scenario Synthesis to Distributional Transmission
  • Communicating Uncertainty: Fan Charts, Confidence, and Credibility
  • Transfers, Taxes, and the Ricardian Equivalence
  • Can Institutions Limit the Economic Damage of Populism?
  • Asia’s Expanding Non-Dollar Payment Networks

Sections

  • AI
  • Banking
  • Books
  • Brexit
  • CBDC
  • China
  • Climate
  • COVID-19
  • Crypto
  • Demographics
  • Economic Growth
  • Economic Science
  • Economics of Information
  • Emerging Markets
  • Eurozone
  • Financial Markets
  • Geoeconomics
  • Geopolitics
  • India
  • Inequality
  • Inflation
  • International Economics
  • Macro
  • Markets
  • Monetary Policy
  • Oil
  • Politics & Economics
  • Taxation
  • Tech
  • Trade
  • U.S.
  • Ukraine-Russia War
  • Uncategorized
  • Useful Data

© 2026 e-axes

  • Privacy Policy & Terms of Service

Theme by Anders Norén

This website uses cookies to improve your experience. We'll assume you're ok with this, but you can opt-out if you wish.
Cookie settingsAccept
Privacy & Cookies Policy

Privacy Overview

This website uses cookies to improve your experience while you navigate through the website. Out of these cookies, the cookies that are categorized as necessary are stored on your browser as they are as essential for the working of basic functionalities of the website. We also use third-party cookies that help us analyze and understand how you use this website. These cookies will be stored in your browser only with your consent. You also have the option to opt-out of these cookies. But opting out of some of these cookies may have an effect on your browsing experience.
Necessary
Always Enabled
Necessary cookies are absolutely essential for the website to function properly. This category only includes cookies that ensures basic functionalities and security features of the website. These cookies do not store any personal information.
SAVE & ACCEPT