Recent trends in inequality
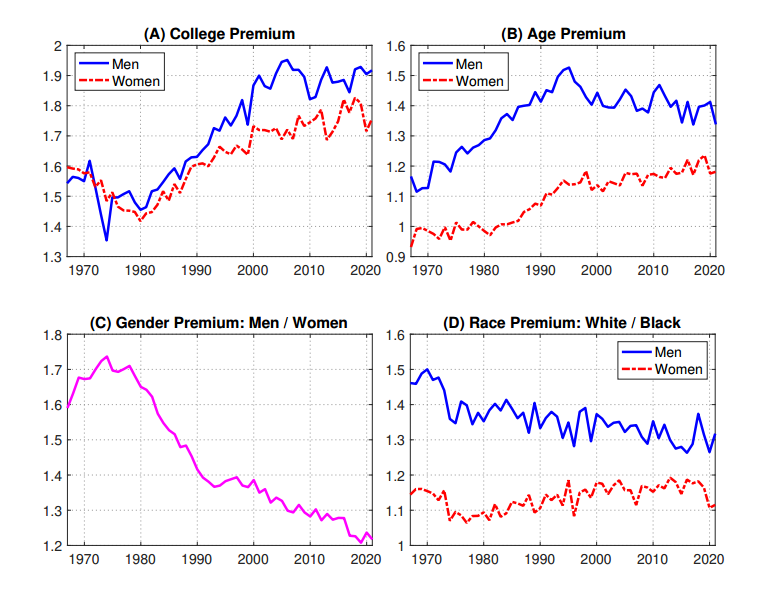
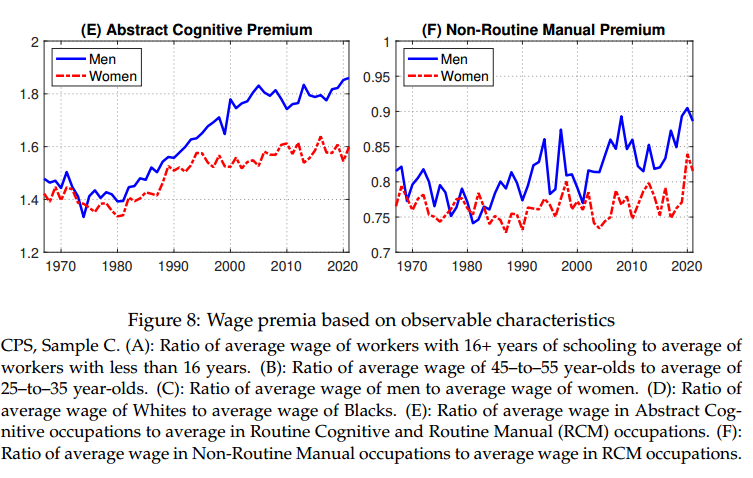
Heathcote et al., in this paper, conduct an empirical analysis of several dimensions of inequality in the United States over the years 1967-2021. Some of their findings include:
- Both individual and household level inequality have kept increasing since 2000, though less rapidly than in previous years.
- Inequality dynamics at the bottom have been dominated by cyclical fluctuations rather than by a long-run trend. Inequality above the median has been driven by wage differentials, while below the median, employment differentials are the key driver.
- Income pooling within the family and redistribution by the government have enormous impacts on the level and trend of household inequality. Over time, the role of income pooling within the household has been declining, while the role of government redistribution has been increasing.
- Since the early 2000s, the college wage premium has stopped growing, and the race wage gap has stalled. However, the gender wage gap has kept shrinking.
- Surprisingly, with all the caveats that apply to the measurement of consumption expenditures in surveys, consumption inequality appears remarkably stable over time.

More Unequal We Stand? Inequality Dynamics in the United States, 1967–2021
Authors: Jonathan Heathcote, Fabrizio Perri, Giovanni L. Violante, Lichen Zhang
From: Federal Reserve Bank of Minneapolis, Princeton University, University of Hong Kong
Digitalization and its impact on consumption inequality
Arvai and Mann developed a novel dataset where data on digital technology used in the production process were linked to U.S. consumption data, to analyze the impact of digital technology on consumption inequality. In particular, they use data from the U.S. Bureau of Economic Analysis (BEA) to identify capital goods that relate to Information and Communication Technology (ICT) and compute their share in industry-level capital stocks. Their resulting digitalization measure covers 61 industries between 1960 and 2017 and shows that during this period the overall capital stock has increased from almost 0% to over 16%. The authors then link this digitization measure to consumption categories and construct the overall ICT share of consumption baskets along the income distribution. They find that rich households have a 13% larger ICT share in consumption than poor households. What do these conclusions imply for consumption inequality in the U.S.?
[D]igitalization affects consumption inequality in two ways: By a polarization of incomes and by a decline in the relative price of digitally produced goods. Both channels work in favor of high-income households. Calibrating the model to the US economy between 1960 and 2017, we demonstrate that the price channel has sizeable welfare effects and amplifies the increase in consumption inequality that is caused by digitalization by around 25%.
Consumption Inequality in the Digital Age
Authors: Kai Arvai, Katja Mann
From: Banque de France, Copenhagen Business School


